Pageants and Champions
Why Show Percentage Scores Instead of Raw Votes?
A candidate’s score falls from 40% to 35%, even though supporters have continued voting. Naturally, they ask: where did the votes go? The answer may be nowhere. A percentage can fall while the underlying score rises, because it describes a candidate’s position relative to something else. That is both the strength and the challenge of percentage-based voting displays: they can make a competition easier to follow, but only when people understand what the numbers actually mean.
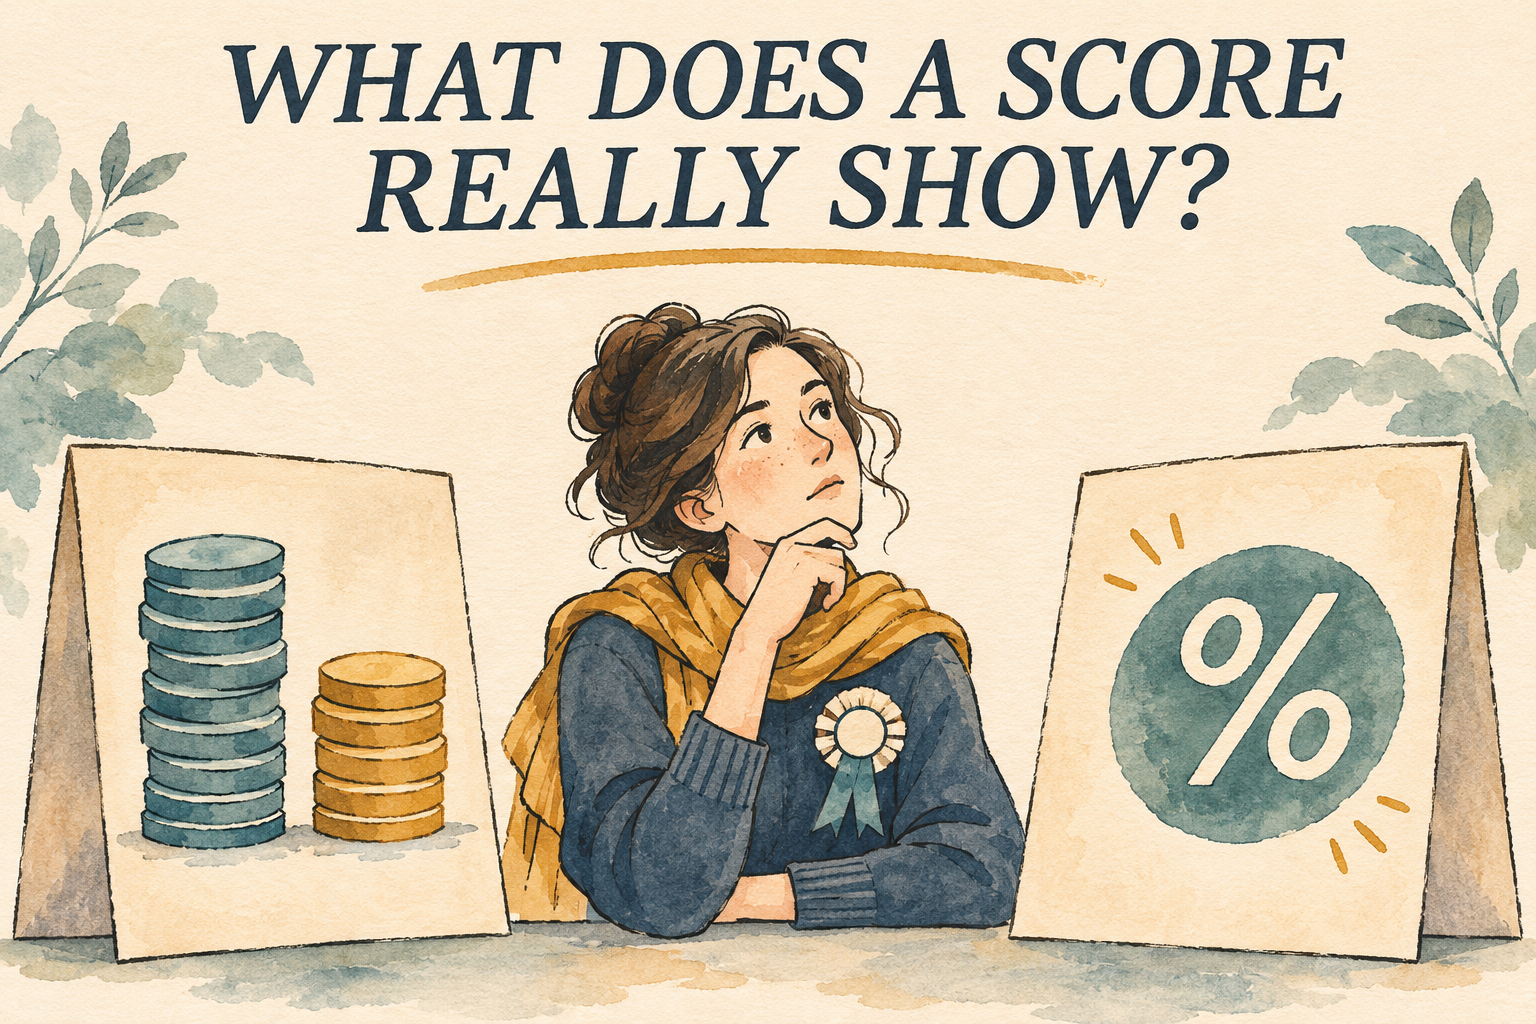
A raw score tells you “how much.” A percentage asks “compared with what?”

Imagine a hypothetical contest in which Candidate A has 4,000 points, Candidate B has 3,500, and Candidate C has 2,500. Those raw scores tell us the exact recorded amounts. Because the total is 10,000, we can also express them as shares of the total: 40%, 35%, and 25%.
Neither display changes who is ahead. When every candidate’s score is divided by the same positive total, the ranking stays the same. What changes is the information emphasized. Raw scores show accumulated amounts and absolute gaps. Percentages show how those amounts relate to the whole competition.
That distinction matters when someone shares a ranking update without additional context. “4,000 points” could represent a commanding lead or a distant last place. “40% of all points” immediately tells us something about that candidate’s share, although we still need the other candidates’ scores to understand the race fully.
However, a percentage sign alone is not enough. A candidate could have 40% of all points, 40% of the leading candidate’s points, or a 40% score calculated from several weighted components. These are different measurements. A clear display must explain what the percentage is a percentage **of**.
Why a percentage can drop without a single point disappearing

Return to our hypothetical Candidate A, who has 4,000 of the contest’s 10,000 points. Suppose supporters add another 200 points, while the other candidates collectively gain 1,800. Candidate A now has 4,200 points, but the overall total has risen to 12,000. The candidate’s share is therefore 35%.
The points increased. The percentage decreased.
For supporters watching closely, that can feel contradictory. They have contributed, refreshed the page, and seen a smaller number. Yet the display is describing relative movement, not necessarily a deduction. Their candidate gained in absolute terms, but other candidates gained faster.
This also explains why a percentage gap is not a fixed number of votes or a fixed amount of money. A five-percentage-point gap in a 10,000-point contest represents a different underlying gap from the same displayed difference in a 100,000-point contest. If additional voting changes the total, it also changes the denominator used in the calculation.
These examples describe a share-of-total system. A system that compares everyone with the leader behaves differently: its leader may remain at 100% while everyone else’s displayed score moves. Organizers should explain the applicable formula rather than assuming supporters can infer it from the screen.
Percentage results are not unique to pageants
A useful public example comes from Britain’s Got Talent. ITV’s published results for the 2023 final show winner Viggo Venn receiving 22.5%, followed by Lillianna Clifton at 13.1% and Cillian O’Connor at 11.8%. The percentages communicate the distribution of the final vote without requiring readers to work through the underlying counts. [ITV’s official 2023 voting results](https://www.itv.com/britainsgottalent/articles/britains-got-talent-2023-voting-percentages-revealed)
The winning percentage also illustrates an important distinction: the largest share is not necessarily a majority. ITV’s rules specified that the finalist with the most valid votes would win. With support divided among many acts, a contestant could finish first without receiving more than half of all votes. [Britain’s Got Talent 2023 voting terms](https://www.itv.com/terms/articles/britains-got-talent-voting-terms-and-conditions)
This is a documented example of percentage reporting, not proof that every percentage-based platform uses the same voting method. Deciding who may vote, how often they may vote, how votes become points, and how a winner is selected are separate choices. Reporting the result as a percentage does not answer all of those questions.
What does this tell us about VOTELABS?
VOTELABS’ use of percentage scores is publicly documented. A July 30, 2025 ranking announcement on the Municipality of Asturias website directed supporters of Binibining Asturias 2025 to VOTELABS and stated that the candidate with the highest percentage score would receive its specified award. The announcement also described daily free voting and optional paid voting. [Municipality of Asturias: Binibining Asturias 2025 ranking update](https://asturiascebu.gov.ph/ranking-update/)
That provides a concrete comparison with ITV: both examples communicate competitive results through percentages. It does not establish that their vote allocation, scoring formulas, safeguards or award rules are identical.
This is especially important when discussing points. A percentage of points is not automatically a percentage of individual people. If a system allows repeated voting or awards different point amounts under different rules, one person may contribute more than one unit to the result. Describing a candidate as holding “40% of the score” therefore does not necessarily mean “40% of voters chose this candidate.”
The distinction is not an argument against points. It is an argument for accurate labels. Supporters should know whether they are reading a share of votes, points, unique voters, or a weighted score before drawing conclusions about popularity or participation.
Do percentages make a competition fairer?

Not by themselves.
If one candidate has twice another candidate’s points, converting those points into shares of the same total preserves that relationship. Percentages do not erase unequal campaign resources, prevent duplicate accounts, verify payments, or determine whether a scoring rule is appropriate. Those issues belong to the underlying voting system.
Presentation can nevertheless affect how people interpret and respond to results. In a 2013 randomized experiment published in *Science*, Lev Muchnik, Sinan Aral and Sean J. Taylor found that manipulated initial ratings influenced later ratings on a social news website. Positive manipulation increased final ratings by 25% on average. [Research abstract](https://pubmed.ncbi.nlm.nih.gov/23929980/)
That study did **not** compare percentages with raw scores in pageant voting. It cannot prove that percentages encourage participation, prevent discouragement or produce fairer winners. Its relevant lesson is narrower: displayed social information can influence later behavior, so claims about the effects of a leaderboard deserve evidence rather than confident assumptions.
For organizers, this creates a practical responsibility. A ranking should inform supporters, not promise that a particular display will eliminate every disadvantage or make an outcome objectively fair.
The strongest display is the one people can explain

Percentages offer a compact way to understand relative standing. Raw scores reveal the underlying scale and absolute differences. Neither is a substitute for clear rules, reliable records and an understandable explanation of how the displayed result was calculated.
Rounding deserves attention too. Two different underlying scores may both appear as 25.00%. That does not necessarily mean the candidates are tied. A competition should explain whether ranking uses full-precision scores and how genuine ties are resolved, rather than leaving supporters to interpret rounded figures on their own.
The most useful question is therefore not simply whether percentages are better than raw numbers. It is whether the chosen display helps people understand this particular competition without inviting conclusions it cannot support.
For VOTELABS and other voting platforms, a percentage should be the beginning of that explanation, not the end. A supporter should be able to understand what the score measures, why it changes, and what it means for the award being contested. When those answers are clear, a falling percentage becomes something people can interpret instead of an unexplained reason to doubt the result.